With a growing focus on advanced statistics and measures, some analysis disregards conventional playing statistics, like steals, points or field goal attempts. But many "advanced" stats are based largely on conventional measures. For example, effective field goal %; (eFG%) simply places greater weight on three point made baskets to account for their value. More complex advanced stats, like PER, combine a range of individual and team conventional statistics, like assists, rebounds, steals, FG%, etc.
Now this isn't to say that advanced stats are deficient in any way. In many cases they are superior measures of performance--because of their ability to account for more than a single measure of play, like just rebounds, or just points--but conventional statistics are of intrinsic value.
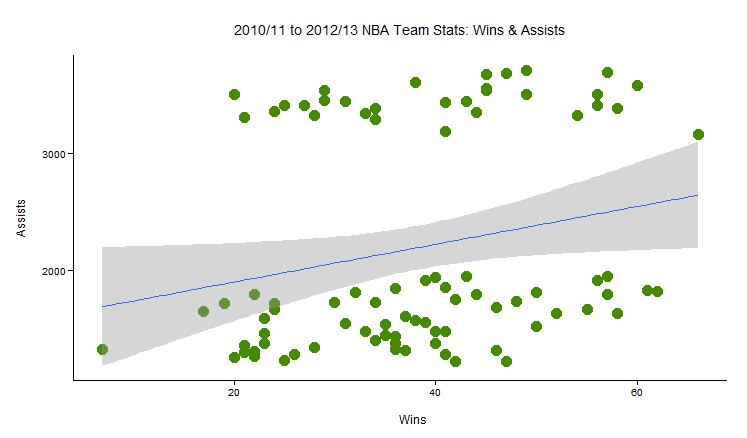
I collected team data from the last three full NBA seasons (2011-12 was cut short 16 games by a collective bargaining agreement work stoppage) and included all conventional team stats from basketball-reference.com (for example . . . ). Next, I cheated and ran a correlation matrix to determine those conventional statistics most correlated with winning and most correlated with losing. Below are charts that show the two conventional statistics most correlated with winning and the one conventional statistic most correlated with losing. (Wins over these three seasons are plotted on the horizontal axis for the first two charts; losses are plotted on the horizontal line for the third chart.)
For each chart I included a linear regression line (blue line) with a 95% confidence region (grey area). The line and grey area give some indication of the relationship between wins and each conventional statistic. The upward slant of the regression line indicates a positive correlation between blocks (first plot) and assists (second plot) with wins. In other words, blocks and assists, rather than FG%, points, or rebounds might represent the most important indicator of a team's success (as measured by regular season wins)
When I ran the correlation matrix, the conventional statistic most highly correlated with losing was fouls. While the association between blocks and assists with winning and fouls with losing does not necessarily hold with individual players, there is some evidence that at the team-level these are critical conventional statistics.


No comments:
Post a Comment